Chapter 1 : Sources of Reservoir Fish Habitat Problems
1.1 Introduction
1.2 A Nationwide Habitat Degradation Survey
1.3 Geographical Patterns in Habitat Degradation
1.4 Reservoir Aging
1.5 Downstream Concerns
1.1 Introduction
Reservoirs have distinct habitat characteristics and degradation patterns due to their terrestrial origin and strong linkage to watersheds. Unlike natural lakes, reservoirs tend to have large watersheds and large tributaries because they were engineered to capture as much water as possible to serve flood control, water supply, navigation, or other purposes. This origin is manifested by relatively large inputs of inorganic and organic loads, nutrients, and contaminants. Depositional filling effectively results in surface area and volume reductions, habitat fragmentation, loss of depth, and associated changes in water quality. Unnatural water-level fluctuations interact with wave action to degrade shorelines that were once uplands and are unable to withstand continuous flooding, which promotes erosion and ultimately homogenization of once diverse littoral habitats. Well-established riparian zones and floodplain wetlands that provide key ecological services to natural lakes and the original river are mostly missing in reservoirs. Lack of woody debris deposition in the littoral zone, limited access to adjacent backwaters, and lack of seed banks and stable water levels to promote native aquatic vegetation characterize barren littoral habitats in many reservoirs, although in some cases there is excessive growth of nonnative aquatic vegetation. Because of their artificial origin reservoirs reveal unique fish habitat problems, exhibit senescing patterns not well correlated with chronological age, and can have major effects on habitats downstream from the dam.
1.2 A Nationwide Habitat Degradation Survey
Krogman and Miranda (20161) used an online survey to canvass resource man- agers about habitat degradation in reservoirs across the continental USA. The survey included about 75 questions regarding fish habitat in the reservoir and tailrace below the dam, recorded on a six-point degradation scale from 0 to 5: 0 = none, 1 = low, 2 = low to moderate, 3 = moderate, 4 = moderate to high, and 5 = high. The questions in- quired about degradation to water quality and clarity, water fluctuations and flow through, submerged structure and vegetation, littoral and riparian zones, watershed uses, other habitat features of the reservoirs, and issues afflicting fish habitat in the tailrace. The survey also included questions about fish assemblages, fish populations, and fisheries. The fish data were collected on a five-point scale ranging from 1 to 5: 1 = low, 2 = below average, 3 = average, 4 = above average, and 5 = high. Respondents were fisheries biologists charged with managing fish in a specific reservoir, and the responses represented nearly 1,300 reservoirs 250 ac or more, approximately a 25% sample of U.S. reservoirs in that size class.
1.3 Geographical Patterns in Habitat Degradation
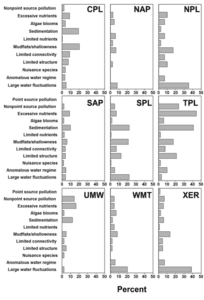
Factor analysis applied to responses to the nationwide habitat degradation survey conducted by Krogman and Miranda (2016) identified 12 major factors descriptive of habitat degradation (Table 1.1). The factors represented various degradations originating from within the reservoir or its watershed. Nationwide, degradation factors such as sedimentation, excessive nutrients, excessive mudflats and shallowness, water-level fluctuations, and limited submerged structure affected 10%–20% of reservoirs (Figure 1.1).
Table 1.1. Major reservoir habitat degradation factors in a sample of U.S. reservoirs ≥ 250 ac as estimated by Krogman and Miranda (2016). Each factor represents several observed variables scored by local fish biologists during an online survey.| Factor | Description |
|---|---|
| Point source pollution | Reservoirs with point source environmental problems stemming from watershed activities, thermal inputs, and contaminants |
| Nonpoint source pollution | Reservoirs with nonpoint source environmental problems stemming from broadly distributed watershed activities |
| Excessive nutrients | Reservoirs with excessive nutrient inputs originating from a broad area of the watershed |
| Algal blooms | Reservoirs with water-quality problems associated with variable oxygen, high temperature, and algal blooms |
| Sedimentation | Reservoirs with high suspended and deposited sediments and associated loss of habitat |
| Limited nutrients | Reservoirs that are often deep and oligotrophic or may be undergoing undesired oligotrophication |
| Mudflats and shallowness | Reservoirs that are excessively shallow particularly in the littoral zone and have extensive mudflats |
| Limited connectivity to adjacent habitats | Reservoirs with a lack or loss of connectivity to adjacent habitats, including backwaters and tributaries |
| Limited littoral structure | Reservoirs with insufficient physical structure and homogenized littoral habitats |
| Nuisance species | Reservoirs with aggressively expanding, typically non-native plant or animal species |
| Anomalous water regime | Reservoirs with frequent or poorly timed fluctuations or flushing |
| Large water fluctuations | Reservoirs with large or long-duration (or both) water-level fluctuations |

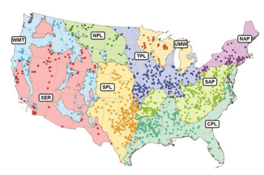
Intensity of degradation differed geographically among ecoregions, and ecoregions often were defined by a unique degradation or set of degradations (Figure 1.2). For example, degradation due to large water-level fluctuation was most common in the drier areas of the contiguous USA, including the West (ecoregions WMT and XER; Figure 1.3) and large sections of the Great Plains (NPL and SPL). Water is scarcer in these areas and typically is collected for irrigation; water levels may fluctuate widely as incoming water is stored during the rainy season and released throughout the growing season. The water storage and allocation required to optimize water availability for irrigation often can conflict with the needs of fish by altering environmental cues or seasonal habitat availability (Ploskey 19862; Bunn and Arthington 20023; Dagel and Miranda 20124). Large water-level fluctuation was also the most important degradation in the Northeast (NAP); however, the extent of this degradation was relatively lower than in other regions.

Unlike the West, most habitat degradation in the Midwest (TPL and UMW) and South (CPL) emphasized factors reflective of incoming water quality and land management in the reservoir’s watershed rather than water storage. A reservoir’s watershed is often the primary source of inputs into the reservoir, including nutrients, sediment, chemicals, and other pollutants (Kimmel and Groeger 19865; Kennedy and Walker 19906; Thornton 19907). Excessive nutrient input was the most important degradation in the Midwest, followed by sedimentation and nonpoint source pollution. Runoff from agricultural land contributes to all of these degradations; farm land covers more than 72% of Iowa (ISU 20138) and 60% of Illinois (IDNR 20139). In the South, sedimentation and mudflats and shallowness were the most important degradations, whereas excessive nutrient input was less important.

Interestingly, this lowered importance of nutrients coincides with less land coverage by traditional agricultural land and greater land coverage by timber land. In the southeastern states of Florida, Georgia, North Carolina, South Carolina, and Virginia, about 60% of the land is forested, and over 95% of the forested land is considered timber land (Smith et al. 200910). This region includes about 12% agricultural land (USDA 200911). In the south central states of Alabama, Arkansas, Kentucky, Louisiana, Mississippi, Oklahoma, Tennessee, and Texas, about one-third of the land is forested, with over 90% considered timber land; this region also has about 20% agricultural land (USDA 2009).
Commercial forestry practices such as roadbuilding and clear-cutting during harvest could export additional sediment and, to a lesser degree, nutrients to waterways directly (Ensign and Mallin 200112) or indirectly by altering streamflow (Troendle and Olsen 199413). Thus, reservoirs in the Midwest and South show faster rates of sedimentation and eutrophication than in other regions and hence faster functional aging as defined in section 1.4. The close ties among land use, eutrophication, and functional age were demonstrated effectively for Kansas reservoirs by Carney (200914).
1.4 Reservoir Aging
- Krogman, R. M., and L. E. Miranda. 2016. Rating of U.S. reservoirs relative to fish habitat condition. Lake and Reservoir Management 32:51–60.
- Ploskey, G. R. 1986. Management of the physical and chemical environment: effects of water-level changes on reservoir ecosystems, with implications for fisheries management. Pages 86–97 in G. E. Hall and M. J. Van den Avyle, editors. Reservoir fisheries management: strategies for the 80s. American Fisheries Society, Bethesda, Maryland.
- Bunn, S. E., and A. H. Arthington. 2002. Basic principles and ecological consequences of altered flow regimes for aquatic biodiversity. Environmental Management 30:492–507.
- Dagel, J. D., and L. E. Miranda. 2012. Backwaters in upper reaches of reservoirs produce high densities of age-0 crappies. North American Journal of Fisheries Management 32:626–634.
- Kimmel, B. L., and A. W. Groeger. 1986. Limnological and ecological changes associated with reservoir aging. Pages 103–109 in G. E. Hall and M. J. Van den Avyle, editors. Reservoir fisheries management: strategies for the 80s. American Fisheries Society, Bethesda, Maryland.
- Kennedy, R. H., and W. W. Walker. 1990. Reservoir nutrient dynamics. Pages 109–131 in K. W. Thornton, B. L. Kimmel, and F. E. Payne, editors. Reservoir limnology: ecological perspectives. Wiley, New York.
- Thornton K. W. 1990. Sedimentary processes. Pages 43–70 in K. W. Thornton, B. L. Kimmel, and F. E., Payne, editors. Reservoir limnology: ecological perspectives. Wiley, New York.
- ISU (Iowa State University). 2013. Crop and land use: statewide data. Available online: www. Extension. Iastate. Edu/soils/crop-and-land-use-statewide-data
- IDNR (Illinois Department of Natural Resources). 2013. Land cover database by categories: cropland. Available online: http://dnr. State. Il. Us/orep/ctap/map/category. htm
- Smith, W. B., P. D. Miles, C. H. Perry, and S. A. Pugh. 2009. Forest resources of the United States, 2007. U.S. Department of Agriculture Forest Service, General Technical Report WO-78, Washington, D.C.
- USDA (U.S. Department of Agriculture). 2009. 2007 census of agriculture. Volume 1, part 51, United States summary and state data. Chapter 1, United States data. U.S. Department of Agriculture, National Agricultural Statistics Service, Washington, D.C.
- Ensign, S. H., and M. A. Mallin. 2001. Stream water quality changes following timber harvest in a coastal plain swamp forest. Water Resources 35:3381–3390.
- Troendle, C. A., and W. K. Olsen. 1994. Potential effects of timber harvest and water
management on streamflow dynamics and sediment transport. Pages 34–41 in Sustainable Ecological Systems: Implementing an Ecological Approach to Land Management. General Technical Report RM-247. U.S. Department of Agriculture, Forest Service, Rocky Mountain Forest and Range Experiment Station Fort Collins, Colorado. - Carney, E. 2009. Relative influences of lake age and watershed land use on trophic state and water quality of artificial lakes in Kansas. Lake and Reservoir Management 25:199–207.
Become a Contributing Sponsor
Become a part of projects that need your support.

